- 0 Posts
- 62 Comments

awww so sleepy 🥱

 242·2 个月前
I‘ve said it before and I‘ll say it again: Gates is not a saint, but there is clearly a difference between him and fucks like Thiel, Sacks or the Koch family who would never consider donating any of their money to research ways to eradicate Malaria or fund education programs for women.
Not the full picture: He plans to donate the majority of his wealth to his foundation, and then wind it down in 20 years. source
 112·4 个月前
I am a bit too dumb to understand that graph and asked ai for an explanation. It helped me, maybe it also helps others:
This graph comes from a study by Gilens and Page that examines how different groups influence U.S. policy decisions. It has three separate charts, each showing how policy adoption (whether a policy is enacted) relates to the preferences of different groups:
1. Average Citizens’ Preferences (top chart)
2. Economic Elites’ Preferences (middle chart)
3. Interest Group Alignments (bottom chart)
Breaking It Down:
• X-axis:
• In the first two graphs, it represents how much each group supports a policy (from 0% to 100%).
• In the third graph (Interest Groups), the x-axis shows alignment, with negative values meaning opposition and positive values meaning support.
• Y-axis:
• The left y-axis (dark line) shows the predicted probability of a policy being adopted.
• The right y-axis (gray bars) shows how often different levels of support occur in the data (percentage of cases).
Key Takeaways & Surprises:
1. The top chart (Average Citizens) is nearly a flat line.
• This means that whether the general public strongly supports or opposes a policy has little impact on whether it gets adopted.
2. The middle chart (Economic Elites) has a rising curve.
• This suggests that policies supported by the wealthy have a much higher chance of being adopted.
3. The bottom chart (Interest Groups) also shows a strong upward trend.
• The more interest groups align in favor of a policy, the more likely it is to be adopted.
Big Picture:
This graph suggests that the opinions of average citizens have little to no effect on policy decisions, while economic elites and interest groups have significant influence. This challenges the idea that the U.S. operates as a true democracy where the will of the majority decides policy.
Hard to compete with that 90s confidence 😎
„It‘s totally a lot smarter than I am, no way could I deliver (234 * 534)^21 as confidently!“
I want those fuckers powering little submarines that fight cancer cells right now - but realistically speaking, these microcontrollers would need to be at least one order two order of magnitude smaller for that, no?
Ya interesting, your theory of mind checks out for me. I’m not “rich” as in “I have significant capital”, but I’m certainly more “rich” than “poor”. So yes, I don’t notice it when I pay ~30EUR per month for a newspaper.
Are there any independent newspapers in your country? I Germany, there’s taz, a daily newspaper that is owned by a cooperative. They certainly don’t give a shit about the rich & powerful’s opinion - for example, they publicly pissed off the editor-in-chief of Germany’s biggest and most-powerful news corporation, Springer, just for the sake of free speech. Would you be willing to give money to that kind of newspaper?
I see your opinion, I’m curious to hear how you think about the media’s role in society. Journalists work at newspapers and they need to pay rent. A stance “paywalls are paid for by the rich and the stupid” kinda means that one doesn’t want to pay journalists.
I am genuinely curious about your perspective on this. Would you prefer a world without newspapers? Or is it more of a question of money? When I was younger, I didn’t have the money to pay for newspapers. Nowadays, I’m happy to pay for newspapers that interest me.
 10·5 个月前
Every time someone pointed out they hate groups of people, in arbitrary subcategories, they got downvoted.
There, I fixed that for you.
Happened to us in 1933 already. Question is if we manage to remember what that lead us into. Will people make the same mistake twice?
To those saying Germany is experiencing the same dynamic that lead to the anti-democratic government takeover in the US: Hold your horses.
- AfD is polling at ~20%. That’s objectively very bad, however, 80% of voters support democratic parties. US fascists won a majority of voters - we‘re far from that.
- AfD is isolated in the parliament - other parties ignored their existence in the parliament for the entirety of this parliament‘s turn. They simply refuse to work with AfD. This means that every vote for AfD becomes meaningless the day after the election.
- For weeks, there have been millions in the streets all over Germany, demonstrating against AfD and fascist movements. That’s happening despite Germany going through a recession for the third year in a row - we’re experiencing the worst economic crisis in decades.
There are way more differences than that, but I’ll stop here. We’re far from what’s happening in the US. The trend is concerning though, and if the economic crisis continues, together with soaring inequality and the creation of an oligarch class of the super-rich, we might be in a bad spot in a decade or so.
- Make up a challenge.
- Have your AI win that challenge.
- Report „My AI is the best AI at this challenge!
- Watch your stocks go up.
Genius.
I work in tech in Germany. My coworkers and I are the ideal Tesla customers. Nobody I know would consider buying a Nazi car.
 51·6 个月前
Because it’s useful propaganda. It’s how you win wars using the media. The bad guys do it, and the good guys, too.
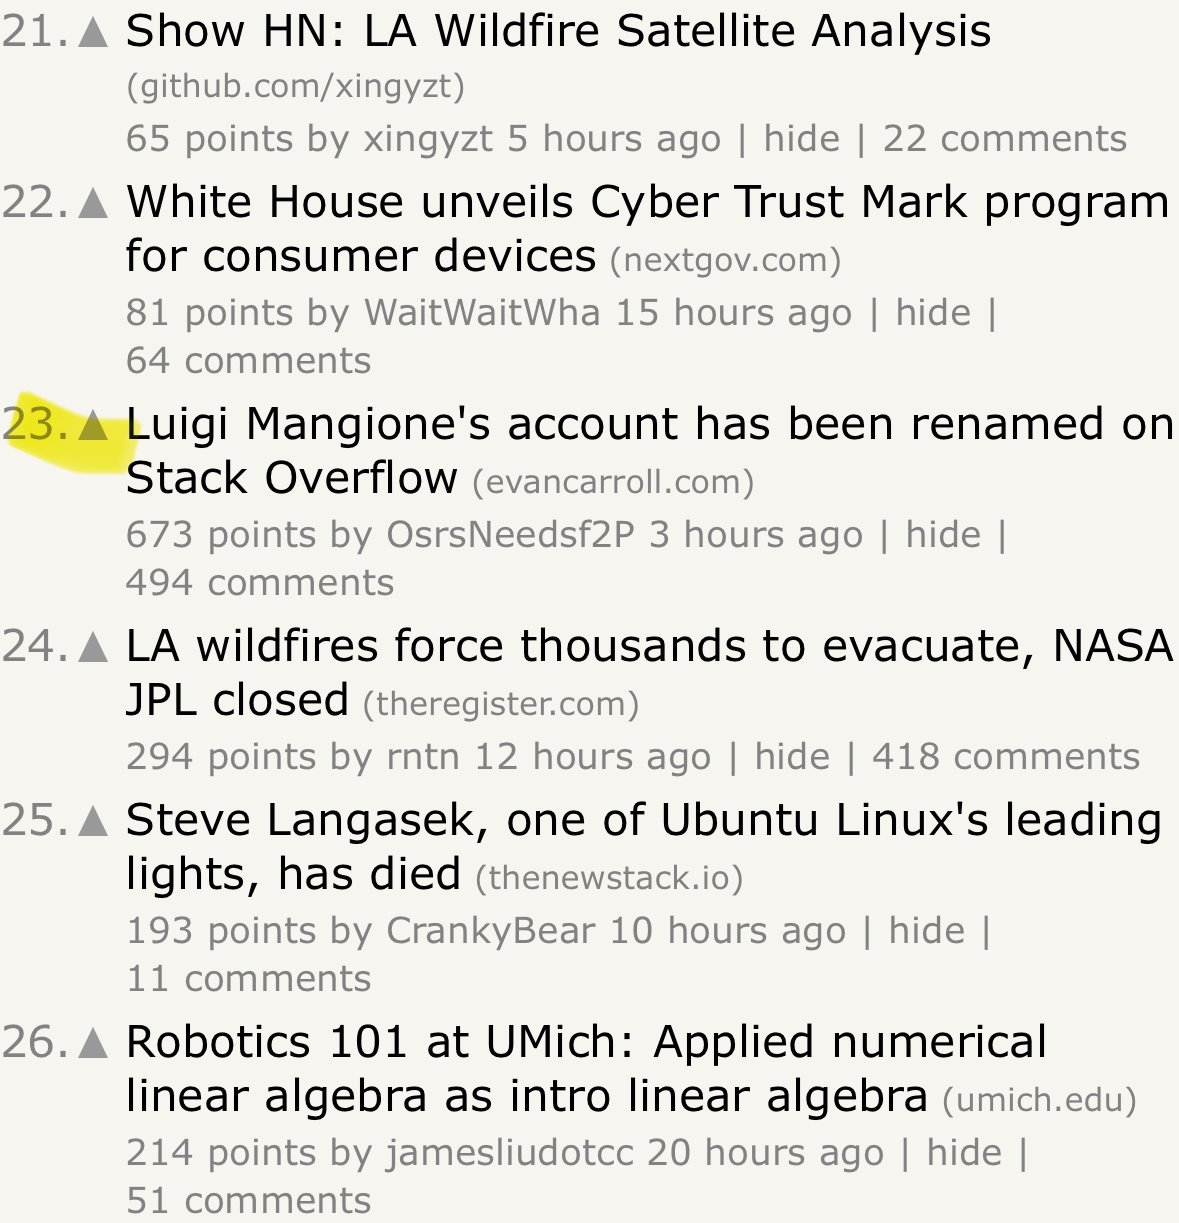
The submission has been clearly penalized by hn moderators: Posted 3h ago, upvoted >600 times with almost 500 comments, ranking 23rd on the front page. Ranking first currently is a submission with 80 upvotes, posted 1h ago.
Do you speak German or Dutch? It‘s not a documentary, but Toine Heijmans wrote a spectacular book on mountaineering called Zuurstofschuld. There‘s only a German translation though so far. I read the thing cover-to-cover in three days, best read I‘ve had in a while.